Overview
Donchian Channels are three lines generated by moving average calculations that comprise an indicator formed by upper and lower bands around a mid-range or median band. The upper band marks the highest price of a security over N periods while the lower band marks the lowest price of a security over N periods. The area between the upper and lower bands represents the Donchian Channel. Career futures trader Richard Donchian developed the indicator in the mid-twentieth century to help him identify trends. He would later be nicknamed "The Father of Trend Following".
KEY TAKEAWAYS
- The indicator seeks to identify bullish and bearish extremes that favor reversals as well as breakouts, breakdowns and emerging trends, higher and lower.
- The middle band simply computes the average between the highest high over N periods and lowest low over N periods, identifying a median or mean reversion price.
Description
Donchian Channels identify comparative relationships between current price and trading ranges over predetermined periods. Three values build a visual map of price over time, similar to Bollinger Bands, indicating the extent of bullishness and bearishness for the chosen period. The top line identifies the extent of bullish energy, highlighting the highest price achieved for the period through the bull-bear conflict. The center line identifies the median or mean reversion price for the period, highlighting the middle ground achieved for the period through the bull-bear conflict. The bottom line identifies the extent of bearish energy, highlighting the lowest price achieved for the period through the bull-bear conflict.
The Formula for the Donchian Channels Is:
DonchianChannel Upper = HH (n), the highest of all High values (Highest High) for n periods.
DonchianChannel Lower = LL (n), the smallest of all Low values (Lowest Low) for n periods.
DonchianChannel Middle = (DonchianChannel Upper + DonchianChannel Lower) / 2.
To find out more about this indicator and it`s trading signals click here.
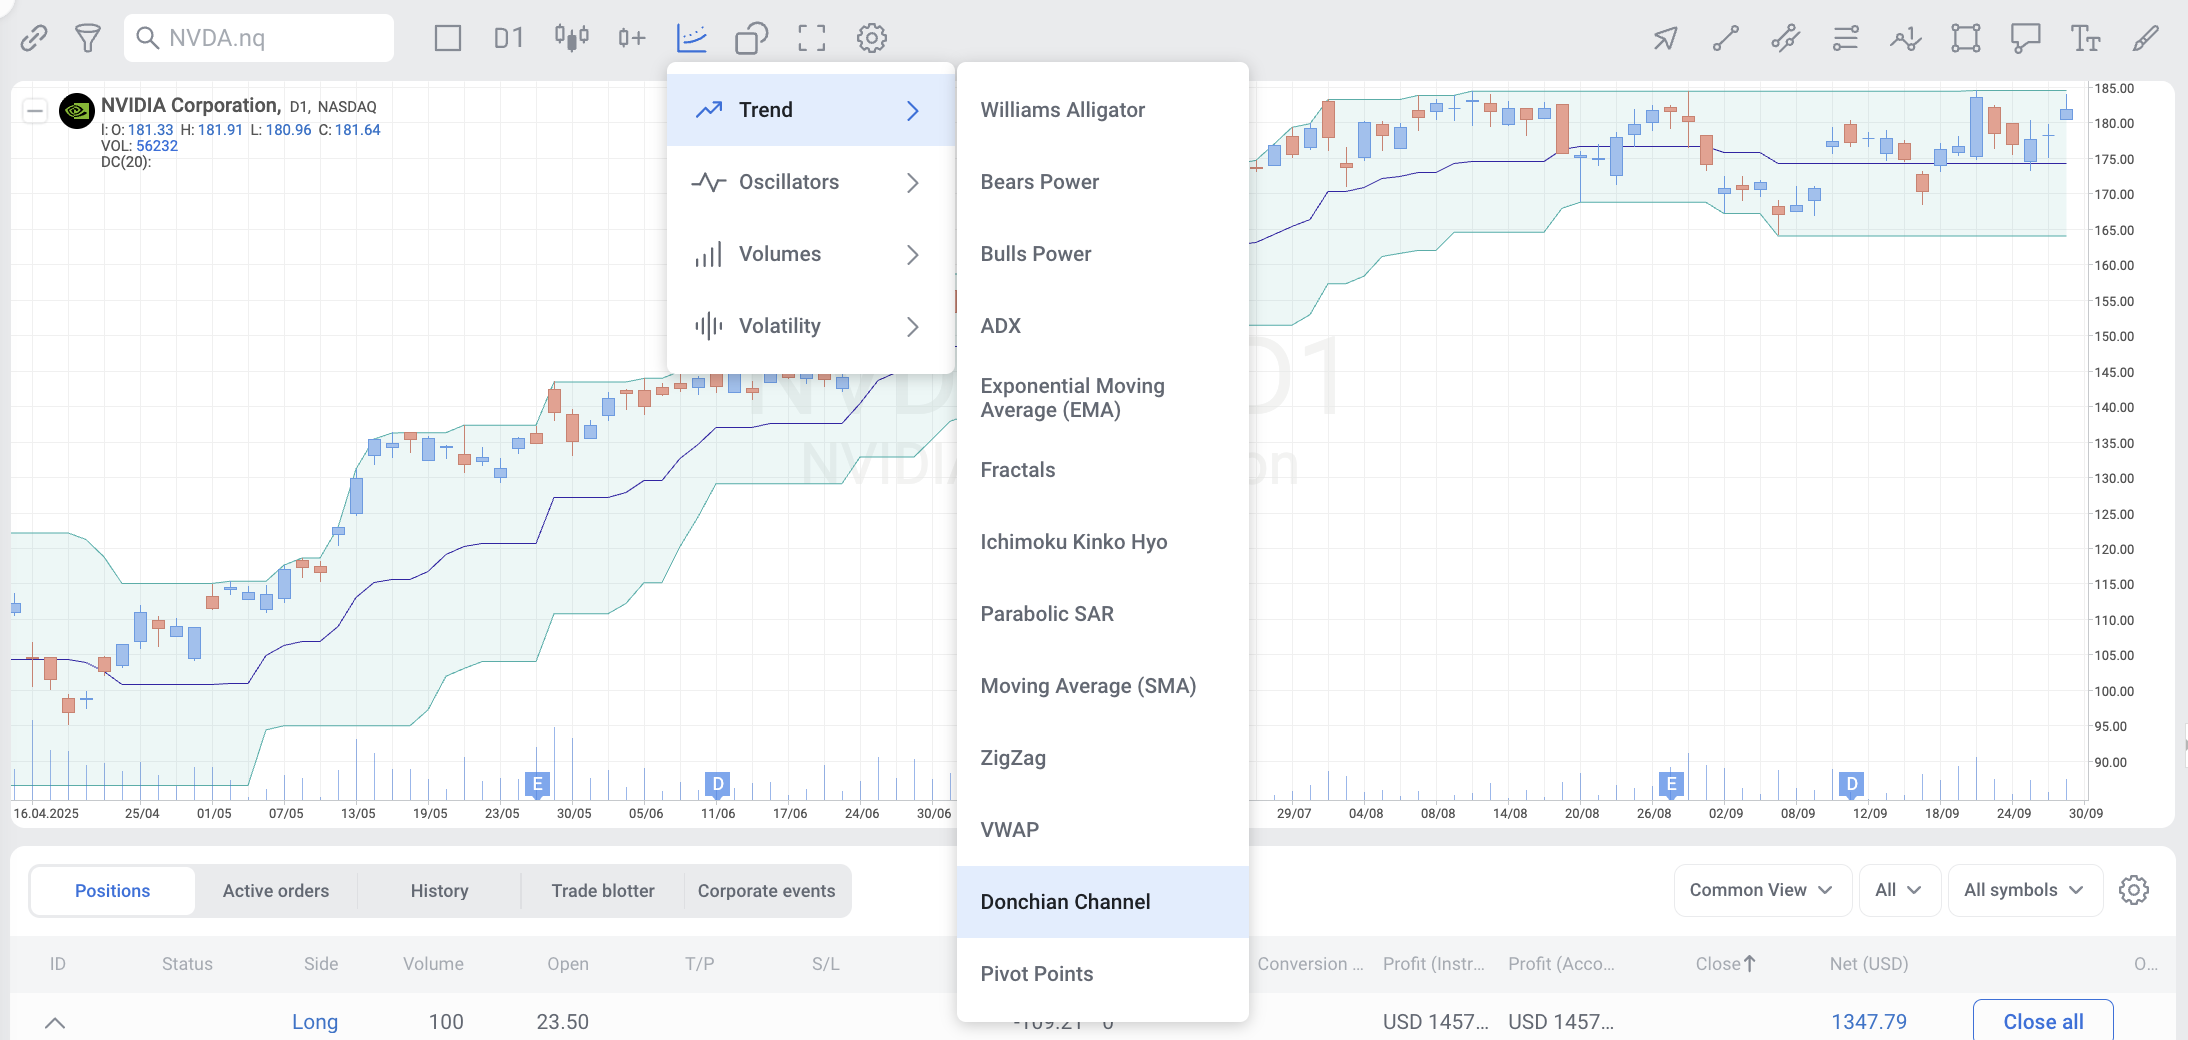
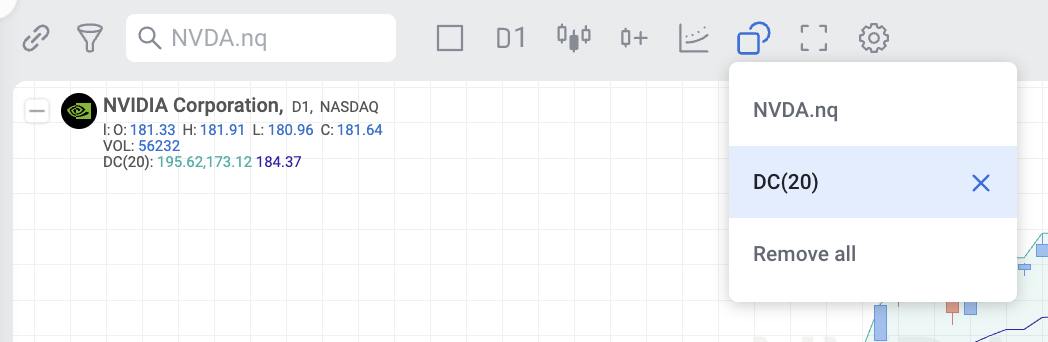
Settings in the chart

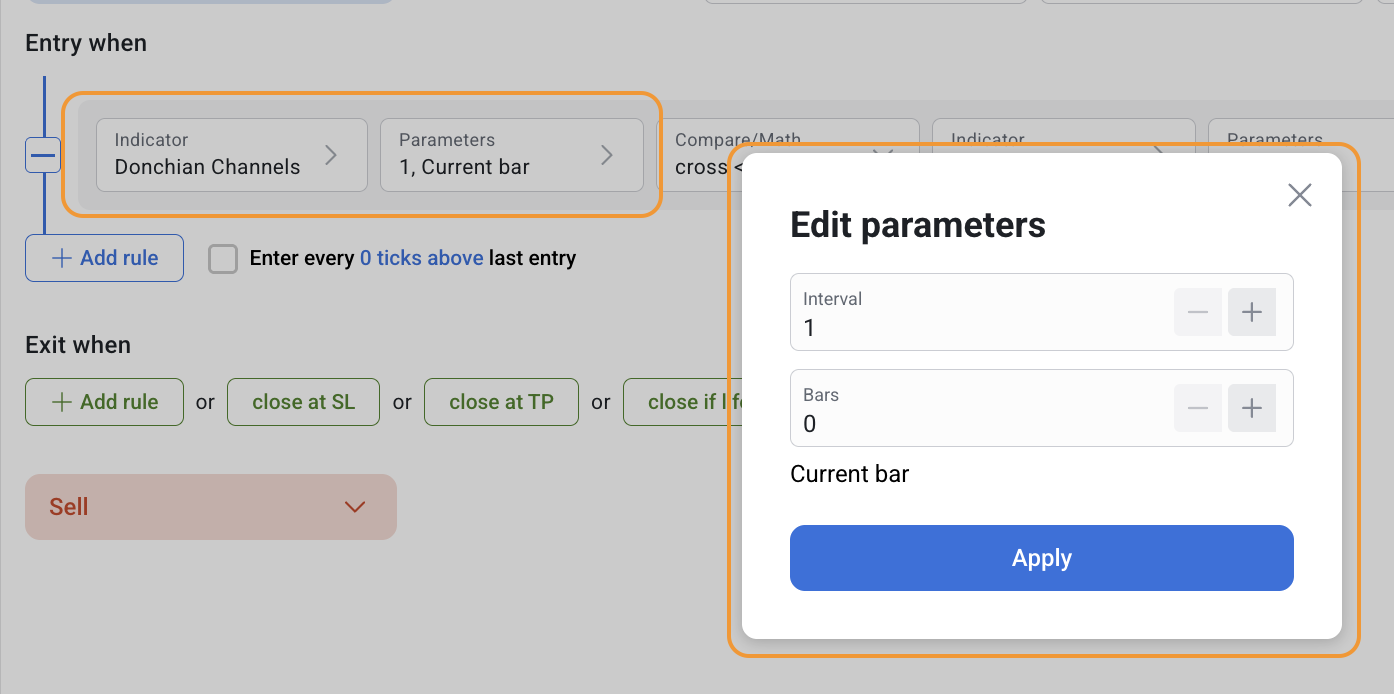
Settings in Strategies
Donchian Channels can be used both separately and together with other indicators in the RoboBuilder.