Description of chart settings
1. Candles tab
Settings for the chart type – Candles

- Up color (Candle color up)
- Down color (Candle color down)
- Up border (Candle border up)
- Down border (Candle border down)
2. Bars tab
Settings for the chart type - Bars
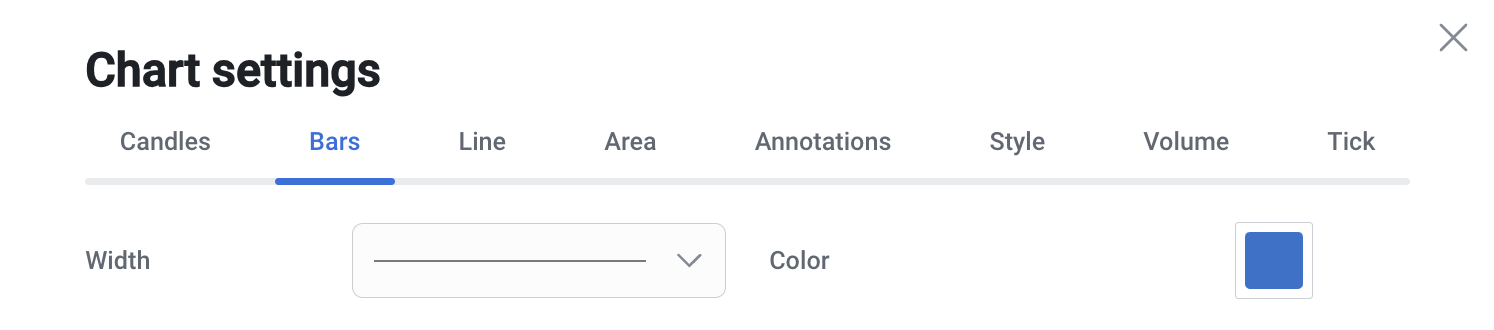
- Width (Line thickness selection)
- Color (Сolor selection)
3. Line tab
Settings for the chart type - Line

- Dash (Line style)
- Apply (setting the calculation method when displaying the chart: Close, Open, High, Low, HL / 2, etc.)
- Width (Line thickness selection)
- Color (Сolor selection)
4. Area tab
Settings for the chart type - Area
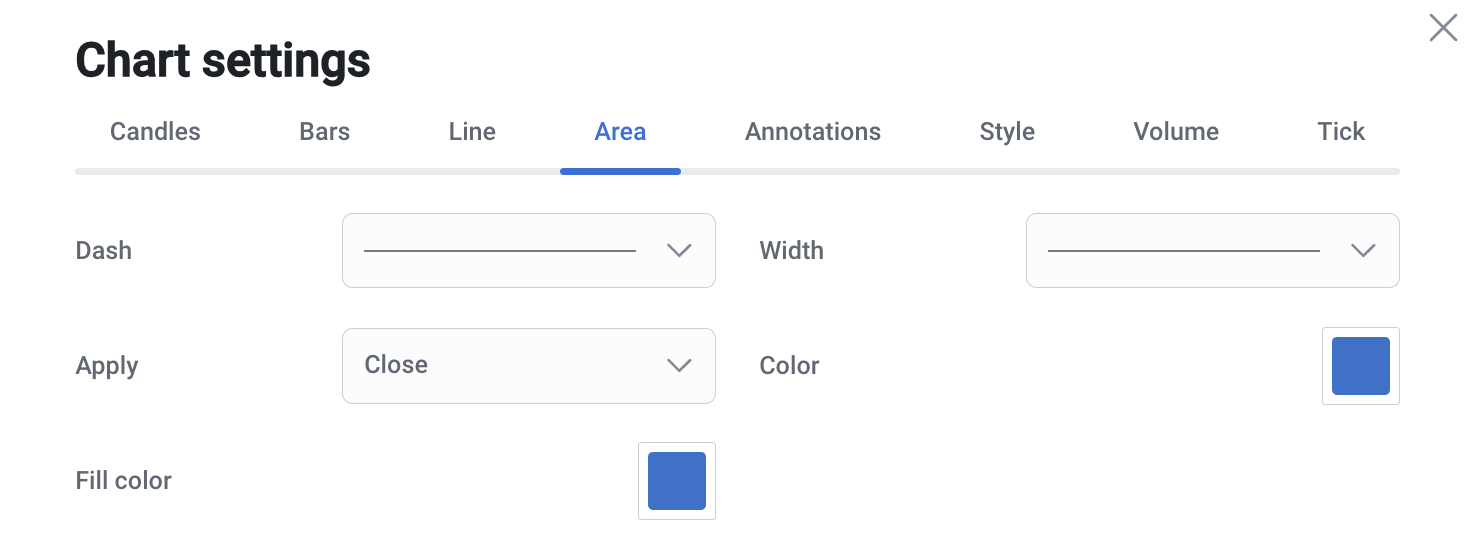
- Dash (Line style)
- Apply (setting the calculation method when displaying the chart: Close, Open, High, Low, HL / 2, etc.)
- Width (Line thickness selection)
- Color (Сolor selection)
- Fill color (Area fill color)
5. Annotations tab
Price level display settings for all chart types

- Bid (display the Bid price level)
- Ask (display the Ask price level)
- Bid color (color of the Bid price level)
- Ask color (color of the Ask price level)
6. Style tab
Style settings for all types of charts
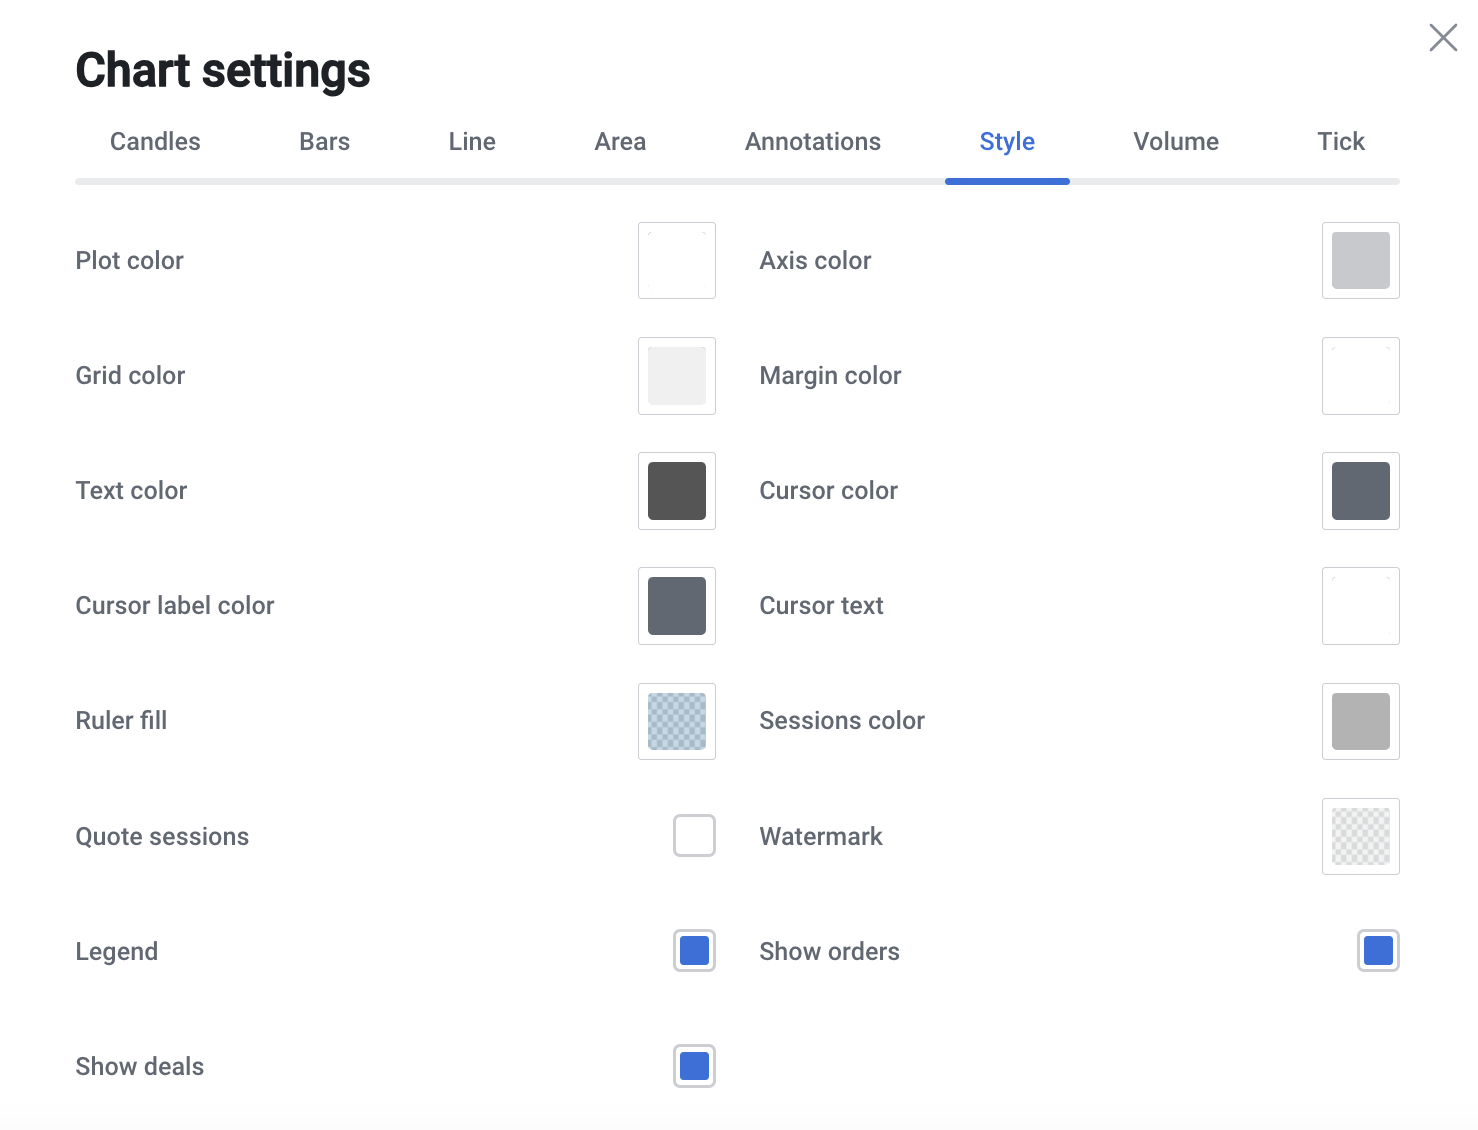
- Plot color (background color selection)
- Grid color (choice of grid color)
- Text color (choice of text color on the price scale)
- Cursor label color (cursor label color on the price scale)
- Ruler fill (select the color of the filled area of the ruler)
- Quote sessions (activation of the trading session separator line)
- Legend (chart data: instrument, period, OHLC, indicators)
- Show deals (show deals on the chart)
- Axis color (choosing the color of the timeline border and the price on the chart)
- Margin color (choosing the color of the time scale area and the price on the chart)
- Cursor color (selection of the cursor line color)
- Cursor text (selection of the cursor color on the price scale)
- Sessions color (choosing the color of the line separator of the trading session)
- Watermark (choosing the color of the watermark on the chart)
- Show orders (show orders on the chart)
7. Volume tab
Volume indicator settings for all chart types
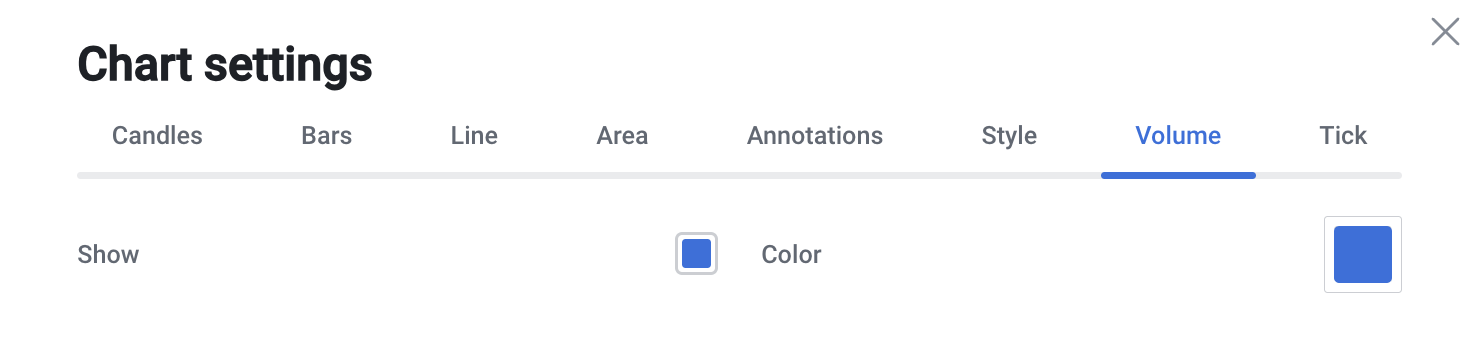

- Show (show Volume on the chart)
- Color (select the color of the indicator)
8. Tick tab
Chart settings – Ticks

- Bid (display the Bid price level)
- Ask (display the Ask price level)
- Price (display of the Last price level; Last price is available for stocks and cryptocurrencies)
- Bid color (color of the Bid price level)
- Ask color (color of the Ask price level)
- Price color (color of the Last price level)